Esponel (es)
 Türkçe (tr)
 Russian (ru)
 한국인 (kr)
 Italiano (it)
 हिंदी (in)
 عربي (ar)
 Français (fr)
 Deutsch (de)
 日本 (jp)
 中国人 (cn)
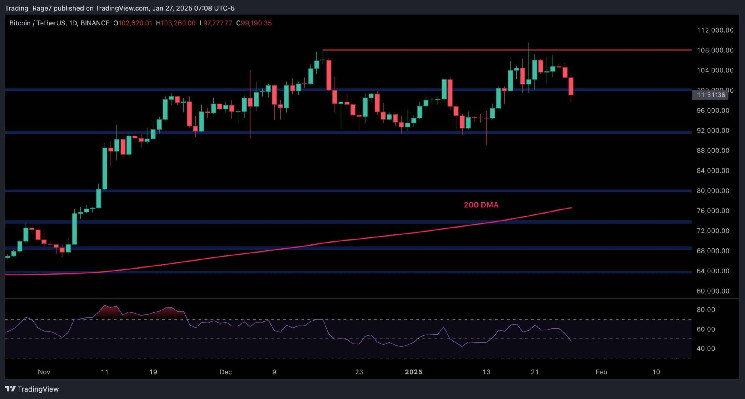
The price of Bitcoin has failed to break above the $108K resistance level and is now correcting lower. The daily chart shows that the price briefly traded above the resistance level but failed to close above it. The RSI is also dropping below 50%, indicating bearish momentum and suggesting a correction in the short term. The 4-hour chart confirms that the $108K resistance level has rejected the asset, causing it to drop below $100K. However, the RSI is currently showing an oversold signal, suggesting a bullish pullback may occur before further downside. Meanwhile, the adoption of Bitcoin in the US has grown, and American investors' buying and selling behavior is heavily influencing market dynamics. The Coinbase premium index, which compares the price of Bitcoin on Coinbase and Binance, has been negative since the beginning of 2025, indicating aggressive Bitcoin selling by American investors. This trend may contribute to further corrections in the market.
 Content Editor
( cryptopotato.com )
Content Editor
( cryptopotato.com )
- 2025-01-27
Bitcoin Price Analysis: BTC Risks Decline to $92K If It Closes Below Crucial Support