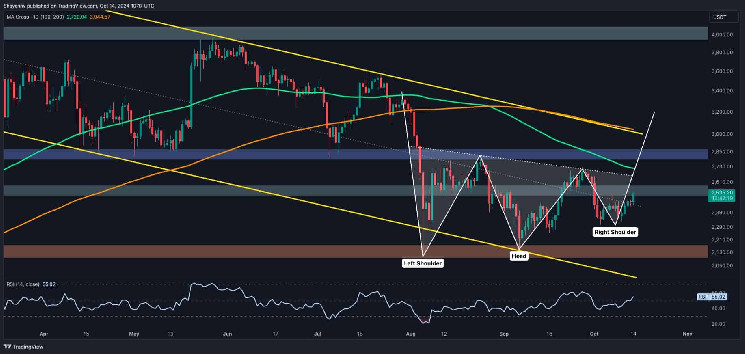
Ethereum is currently in a consolidation phase with no clear direction. However, there are patterns forming on both the daily and 4-hour charts that suggest a potential bullish reversal. The inverted head and shoulders pattern on the daily chart indicates an upward shift in momentum if ETH can break through the $2.7K neckline. The double-bottom pattern on the 4-hour chart also suggests a short-term bullish reversal. Ethereum's price is currently confined within a range of $2.1K and $2.7K, and a breakout in either direction will determine the next primary direction. The Binance liquidation heatmap reveals key liquidity zones that could influence an impending breakout, with the $2K region defended by whales and institutional traders and the $2.8K resistance zone holding significant liquidity. A breakout could trigger a cascade of liquidations and amplify the prevailing trend.
 Content Editor
( cryptopotato.com )
- 2024-10-14
Ethereum Price Analysis: Is ETH About to Break Above $2.6K at Last?

 Esponel (es)
 Türkçe (tr)
 Russian (ru)
 한국인 (kr)
 Italiano (it)
 हिंदी (in)
 عربي (ar)
 Français (fr)
 Deutsch (de)
 日本 (jp)
 中国人 (cn)