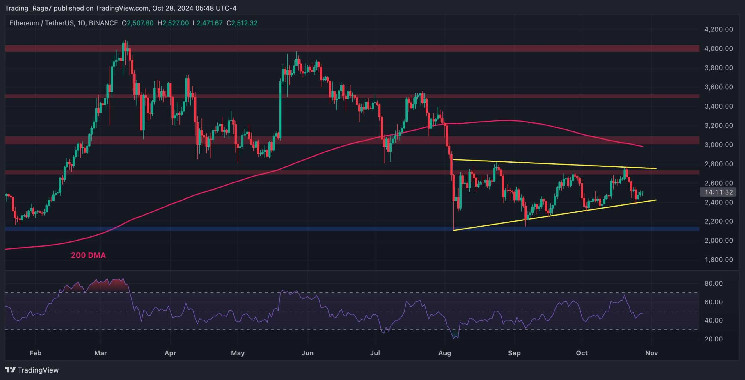
Ethereum's price has been in a consolidation phase with a symmetrical triangle pattern on the daily timeframe. The future direction of the market depends on whether it breaks out of the pattern to the upside or downside. The RSI indicator shows uncertainty in the market. On the 4-hour chart, Ethereum has broken below the $2,500 level but is currently retesting it. If it breaks back above, a rally towards the $2,800 resistance zone is likely. However, a rejection could lead to a decline towards the $2,300 support level. The increasing RSI values suggest a bullish shift in momentum. The exchange reserve metric shows a gradual decline in the amount of ETH held in exchange wallets, indicating accumulation in the spot market. This could potentially lead to a supply shock and a higher rally if the futures market remains stable.
 Content Editor
( cryptopotato.com )
- 2024-10-28
Ethereum Price Analysis: Critical Moment for ETH as it Fights for $2.5K

 Esponel (es)
 Türkçe (tr)
 Russian (ru)
 한국인 (kr)
 Italiano (it)
 हिंदी (in)
 عربي (ar)
 Français (fr)
 Deutsch (de)
 日本 (jp)
 中国人 (cn)