Esponel (es)
 Türkçe (tr)
 Russian (ru)
 한국인 (kr)
 Italiano (it)
 हिंदी (in)
 عربي (ar)
 Français (fr)
 Deutsch (de)
 日本 (jp)
 中国人 (cn)
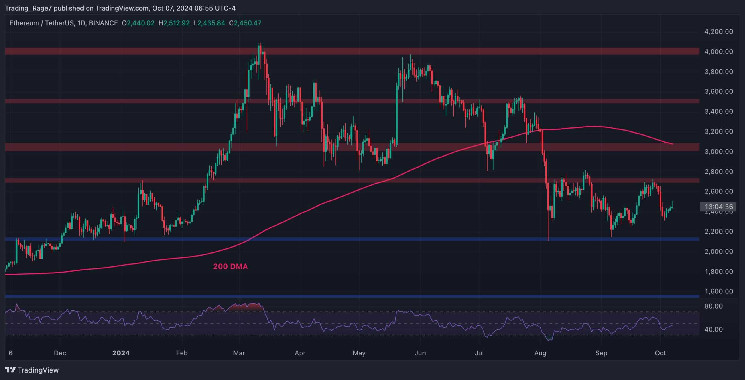
This article discusses the current price consolidation of Ethereum, with the price trading sideways in a range between $2,200 and $2,700. The author suggests that the price may target the $2,200 support level in the coming weeks. However, the bearish momentum is fading according to the RSI, potentially indicating a reversal soon. The 4-hour chart shows a symmetrical triangle pattern, with the $2,500 level being broken and retested, suggesting a test of the lower trendline is likely. The open interest (OI) metric is also examined, showing a correlation between Ethereum's OI and price movement. The OI surged from late 2023 to early 2024, indicating high market engagement and bullish sentiment. However, a sharp decline in mid-2024 suggests a bearish event or liquidation, leading to reduced market activity and a price drop. Overall, the article highlights a more cautious sentiment among traders but suggests that a sustainable rally could occur with sufficient spot demand.
 Content Editor
( cryptopotato.com )
Content Editor
( cryptopotato.com )
- 2024-10-07
Ethereum Price Analysis: ETH Flirts With $2.5K But Bullish Prospects Remain Questionable