Esponel (es)
 Türkçe (tr)
 Russian (ru)
 한국인 (kr)
 Italiano (it)
 हिंदी (in)
 عربي (ar)
 Français (fr)
 Deutsch (de)
 日本 (jp)
 中国人 (cn)
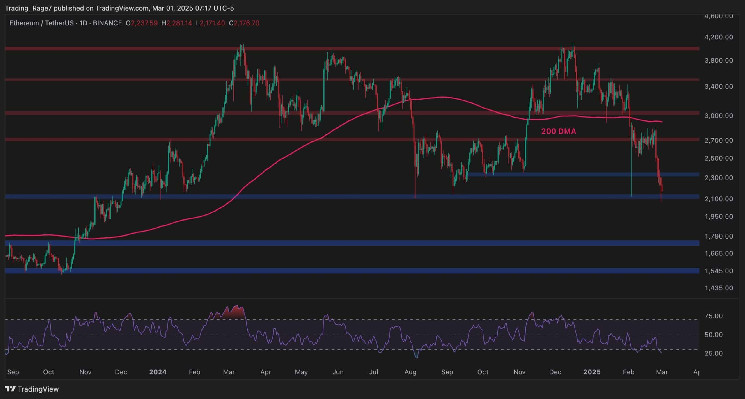
Ethereum has been going through a sharp decline, breaking below key support levels, and investors are uncertain about when this downturn will end. The daily chart shows a rapid drop since falling below the 200-day moving average at around $2,900. The $2,700 and $2,350 levels have also been broken, and the asset is currently testing the $2,100 support zone. If this support level is also broken, further decline towards $1,750 could be expected in the coming months. The 4-hour chart shows consistently lower highs and lows for ETH over the past few months. The $2,100 support level is currently holding the price, but a recovery is possible if ETH breaks above $2,400. However, if the $2,100 level is lost, a more significant drop in Ethereum's price could occur. Some analysts and investors blame the futures market for the crash, but the open interest metric suggests that this might not be the main cause. Despite the significant drop in price, the open interest has not decreased as expected, indicating that selling pressure comes mainly from the spot market. It also warns of the potential for a larger liquidation event that could worsen the situation.
 Content Editor
( cryptopotato.com )
Content Editor
( cryptopotato.com )
- 2025-03-02
Will ETH Stabilize After a 20% Weekly Crash? Ethereum Price Analysis