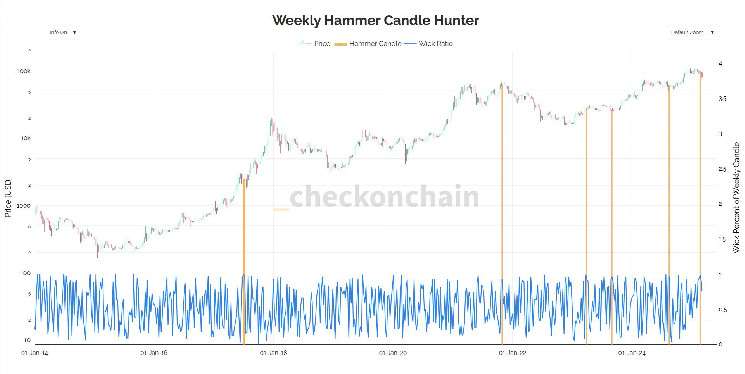
CandleFocus Bitcoin Chart Shows Back to Back Weekly Hammer Candles, Seen Only a Handful Of Times in BTC
2025-03-06
Author: Content Editor
Bitcoin has experienced high volatility in recent weeks, with significant price swings. The past two weeks saw bitcoin trade within a pattern known as a hammer candle, where the lower or upper wick represents 90% of the price range. Analysis shows that bitcoin has formed such candles only five times in its history, with the 2017 bull market correction being particularly noteworthy. While there is no clear pattern, these formations may indicate important turning points in price trends.
Related News
Whale Longs $4.06 Million BTC with 20x Leverage, Now Holds $589,000 Profit Binance's CZ Spotlights BlackRock Bitcoin ETF’s $50 Billion Stash As IBIT Turns 1 Year Old What Is DePIN? Ultimate Guide to Decentralized Physical Infrastructure Networks Toncoin price crashes to a crucial support, gets oversold Stellar Funds Ficc.ai for AI-Based Fixed Income Pricing Innovation VeChain Recognized in Academic Journal for Revolutionizing Global Trade with Blockchain Tech Crypto.com joins CF Benchmarks, enhancing Bitcoin and Ethereum indices Democrats are embracing Bitcoin despite Trump, says lobbyist There is a New Development for Donald Trump’s Tariffs Consumer apps can ‘evolve in parallel’ to infrastructure: Moonrock Capital NEOPIN Plans Migration to Solana Blockchain KyberSwap Integrates NEAR Intents to Enable Seamless Cross-Chain Asset Swaps Stage Is Set for New Bitcoin All-Time High, Says Real Vision Analyst Jamie Coutts – Here’s His Timeline Top Pump.fun trader's profits near $40 million as Solana memecoin volumes shrink Craig Wright ordered to pay $290,000 in legal costs over improper AI usage XRP News: Ripple CEO Brad Garlinghouse To Attend White House Crypto Summit Total crypto market cap could top $4 trillion in Q2 — Analyst XRP Surges 7% as Golden Cross Signals More Gains Will Bitcoin price hit $100k as investors eye Trump’s crypto summit? Texas Senate passes Bitcoin strategic reserve bill Ethereum Experiences $150 Million Buying Spree While Coinbase Spot Volume Rises 3 Ways Bybit's $1.5 Billion Hack Will Impact the Staking Industry Policy Expert Outlines Funding Challenges for US Strategic Crypto Reserve Nigeria’s Crypto Clampdown: Binance Users Blocked From Crypto Giveaway Programs Altcoin Season Remains Elusive as Market Struggles Amid Trump’s Trade Wars Cardano Partners Serpro To Modernize Brazil’s Public Sector Infrastructure Mass Adoption of Web3 Through the Self-Writing Internet Tokenized Asset Manager Superstate Registers Transfer Agent with SEC Crypto VC: Trump’s Strategic Reserve Plan Gets Bitcoin Right, But XRP & Cardano Wrong 'Omnichain' tokenization platform Libre brings institutional funds from the likes of BlackRock, Nomura to Layer 1 network Injective Rate Fears Replace Tariff Fears as Crypto Pulls Back Analyst Predict XRP Price Rally To $5.85 Amid Bullish Breakout What Bitcoin reserve? BTC price slips back below $90K Bitcoin Seesaws as Trump Broadens Tariff Delays XRP Price Turns Bull Green Versus Bitcoin as Golden Cross Nears Bitcoin, ETH, XRP, SOL, ADA charts versus US crypto reserve rumors — Which to trade? How High Can Pi Network Price Get if Bitcoin Rises to $200k? Bhutan Prime Minister Shares How Country’s Bitcoin Reserve Has Funded Social Amenities and Salaries SHIB Price Prediction for March 6 Can 3% Surge Pull Shiba Inu out of Death Cross Zone? Kalp and MIRO Partner to Revolutionize Bitcoin Payments RWA Adoption Bitcoin derivatives market surges as traders position ahead of White House crypto summit Solana DEX volumes still rival Ethereum’s despite memecoin meltdown: VanEck Litecoin (LTC) Price Prediction for March 6 US lawmaker reintroduces CBDC bill after Trump EO bans digital dollar Safe Confirms Full Infrastructure Reset After February Bybit Hack Top 10 Chains by TVL: SX Rollup, Sonic, Soneium, Morph, Hyperliquid Dominate DeFi Growth DOGE Price Prediction for March 6 Kaia-Powered Mini Dapps on LINE Messenger Achieve Explosive Growth in Asia: 35M+ Users Russian crypto hackers hit Ukraine Ministry of Foreign Affairs, report Litecoin traders say LTC price dips below $100 are ‘accumulation’ opportunities Pepe price could surge as MVRV points to ‘opportunity zone’ Ethereum researchers look to prevent major delay of network’s next Pectra upgrade after testnet mishaps, Core Devs say Memes Meet Politics: What the Dogecoin Community Makes of Elon Musk’s DOGE Cardano’s inclusion in US crypto reserve sparks $25 price target speculation in 2025 Ethereum Price Hints at Channel Breakout Rally, Targets $2,700 Analyst Says XRP is Giga Bullish, Will Go Anywhere from $100 to $1,000 in 5 to 10 Years Exclusive: Seismic raises $7M in round led by a16z Crypto Solana Price At $150 Faces Death Cross After 17 Months; New Investors Pullback Crypto VC deals top $1.1B in February as DeFi interest surges — The TIE Ethena Price Gains 17%, But Selling Surges After $833 Million ENA Unlock Here’s How Much 1 Dogecoin Would Be Worth If DOGE Reaches Ethereum Market Cap Tron (TRX) Consolidation Nears Bullish Exit: Is $0.30 Next? US Dollar Index Falls Below Key Support Level: A Bullish Signal for Bitcoin? JPMorgan says XRP, SOL and ADA inclusion in US crypto reserve 'would be difficult' Ethereum Devconnect to Host World Fair in Buenos Aires Cardano (ADA) Suddenly Drops 6%, What's Happening? Will the Cryptocurrency Payment Ban Be Lifted in Türkiye? "The Critical Day is May 28!" Bitcoin Whales Stun Crypto Market With $900,000,000 Withdrawal Ondo price may surge 110% as TVL hits key milestone What is Jasmy?: Japan's Leading Crypto Project 265Dots Platform to Attract Institutional Capital to Polkadot Network Gaming blockchain Oasys launched gaming creation platform Yukichi.fun Noble’s USDN Yield-paying Stablecoin Launched on Cosmos This Catalyst Is Exactly What Altcoins Need To ‘Start Doing Something for Real,’ Says Analyst Kevin Svenson Ripple Price Analysis: How Close Is XRP to Breaking Above $3? Sen. Tim Scott introduces bill to block use of reputational risk amid crypto debanking concerns Uniswap Community Expands ‘Delegate Rewards Initiative’ to Incentivize Active Governance with UNI Tokens AI predicts Ethereum price for March 31, 2025 Bitcoin Price Analysis: Caution Flags as BTC Tests $90K Will Solana Price Skyrocket As VanEck Backs Proposal to Slash Inflation? How Will Bitcoin Price React to Trump’s March 7 Crypto Summit and Nonfarm Payrolls? How can Bukele still stack Bitcoin after IMF loan agreement? IMF: Namibia Has No 'Compelling Rationale' for Retail CBDC Arbitrum crypto surges 12% – ARB can keep rising only IF… Ethereum’s Lack of Washington Policy Presence Raises Eyebrows Ahead of Crypto Policy Summit AI agents and blockchain are redefining the digital economy Andrew Tate struggles to pump memecoin amid Florida criminal inquiry Why you should buy Bitcoin right now (but sell on the weekend) India’s Taxman To Get Sweeping Digital Surveillance Authority 'Crypto: The Game' Competition Back With 'Resurrections' and More Twists 'Eve Frontier' Recruits Central Bank Economist to Develop Ethereum Game's Virtual Economy Core Scientific Shares Drop 15% as Microsoft Cuts CoreWeave Commitments Sam Altman's World Network Unveils New Chat Feature to Connect Real Humans Trump’s crypto czar David Sacks says US government missed out on $17 billion by selling Bitcoin too early Crypto Asset Manager Bitwise Deploys on DeFi Platform With Maple Finance Partnership Blockchain oracle RedStone launches RED token, enabling staking and paving the way for multi-asset rewards Solana Game 'Nyan Heroes' Reveals Biggest Airdrop Yet for Next Playtest Inside Solana's Debate on a Major Reduction in SOL Inflation Lombard Finance to Launch its Liquid-Staking Bitcoin Token LBTC on Sui 549.56 Trillion Shiba Inu (SHIB) Prevent Meme Coin From Growth: What's Going On? Satoshi Nakamoto, Vitalik Buterin Dominate Crypto Mentions: Report WisdomTree, Which Manages $100 Billion, Names Two Altcoins! "These Will Lead the 2025 Rally!" Binance's CZ Issues Critical Security Call to Crypto Industry ADA, SOL, XRP: Altcoins Under Consideration for U.S. Crypto Reserve Lag BTC in Retaking Sunday Highs JUST IN! Trump-Backed Cryptocurrency Project World Liberty Financial Partners With a Very Surprising Altcoin! Price Jumps! New York introduces new bill to crack down on crypto rug pulls and private key theft Galaxy Digital Deposits 600K UNI to Binance & OKX, Totaling 5.26M UNI This Week Ethereum Sees $20 Million Spot Inflows After 10-Day Outflow Streak – What Next for ETH? Payments Infrastructure Provider Transak Expands to Australia Following Exchange Approval Avalanche Starts To Drift Sideways Above $20 BlackRock's IBIT Makes First Bitcoin Purchase in 7 Days Ethereum Crosses $2,300: Bulls Gear Up for $2,500 Breakout Binance CEO Names Key 'Non-Negotiable' Factor for Binance: Details Shiba Inu Netflows Skyrocket 764%, Are Whales Back? Avalanche Tests Key Support as Fibonacci Levels Indicate Potential Reversal Ethereum User Pays $129,000 in Fees for a Single Transfer As AI rewrites history, blockchain technology is a line of defense | Opinion Peter Schiff’s Bitcoin u-turn sparks debate as White House Crypto Summit nears Bitwise Debuts Bitcoin and Gold ETP in Europe Crypto Token Unlock Schedules Shift: Are Projects Changing Emission Strategy or Just Market Dynamics? Brazilian Fintech Méliuz to Allocate 10% of Cash Reserves to Bitcoin Bitcoin struggles near $90K as US tariff fears spook ETF investors Strategy Has Taken 30% of the U.S. Convertible Debt Market in 2025 Will Donald Trump’s Crypto Push Be a Threat to Wall Street? MOVE up 29% after World Liberty Financial investment, will the rally continue? Japan’s ruling party proposes capping crypto tax rate at 20%, matching stocks Ethereum most 'undervalued' in 17-months — Can ETH return to $4K? Bitcoin Cash hits two-month high as analysts predict a 2017-style rally Movement and Gauntlet Partner to Elevate DeFi Innovation Japan Eyes Crypto ETFs Launch Amid Proposed Regulatory Shift Here’s Why Shiba Inu Price Will Never Hit $0.01 Here’s How Much XRP You Need to Hold to Today to Become Millionaire if Price Hits $10 Top Analyst Says a $6.24 Price Remains a Possibility for Dogecoin Reaction to Trump’s crypto reserve: ‘Short-term optimism, long-term caution’ Data Shows XRP Has Outperformed ETH, SOL, Dogecoin and AVAX by at Least 200% Since November 2024 Cronos price soars 15% amid strategic crypto reserve speculations Solv Protocol partners with Soneium to expand BTC staking Bitcoin at $92k Eyes Triangle Breakout Rally: Is $106k Next? Solana Price Crosses $150: Bulls Aim For $200 Milestone Bitcoin Chart Shows Back to Back Weekly Hammer Candles, Seen Only a Handful Of Times in BTC ECB Expected to Cut Interest Rates as Traders Pile Into Fed Easing Bets Deribit Launches Block RFQ System to Improve Liquidity for Large Over-the-Counter Trades ChatGPT picks 2 altcoins to buy and add to your crypto portfolio in March Here’s How Bitcoin Hits $180,000 This Cycle, According to Analyst That Called 2021 Top Expert Says Trump Can Include XRP and ADA in US Crypto Reserve Without Congressional Approval Why Bitcoin Is Going Up? BTC Price Rises for the 3rd Session, Two Buy Signals on the Crypto Chart Shiba Inu (SHIB): This Is Not Recovery, Here's Why Analyst Jason Pizzino Issues Ethereum Alert, Says ETH Looking Very Weak – Here Are His Downside Targets Dogecoin On Course to Mirror XRP 2021 Cycle: Here’s What It Means for Prices AI Developers Turn to Synthetic Data as Original Content Dries Up HBAR Jumps 20% on Nasdaq’s ETF Filing, Yet Key Indicators Suggest Caution Crypto price predictions: Ondo Finance, Mantra, Gala coin Bitcoin Surges to $92K, XRP Prices Muted as White House Crypto Summit Looms Was the South Korean crypto OTC trader’s murder premeditated? Police reveal new details Will Bitcoin Price Crash Below $80,000 or Rebound to a New ATH? Paradigm leads KaitoAI’s crypto VC performance rankings How Did Ethereum Whales Behave in the Recent Drop? What Is the Most Critical Level to Watch for ETH? Glassnode Explained! White House Crypto Summit 2025: Everything important you need to know ? Solana (SOL) Founder Presents 3 Major Scenarios for US Strategic Reserve Michael Saylor: XRP Issuance Should Be Under Regulatory Framework Tether Freezes Garantex Accounts Worth Approximately $28 Million: What’s Happening? Bitcoin Price Hits $92k: Will BTC Recovery Cross $100k? Axie Infinity teases new Web3 game as NFT outlook turns positive Hotcoin Global Teams Up with BSK for User-Friendly Decentralized Solutions Crypto Exchange Storage: Why “Not Your Keys, Not Your Coins” Top Trader Says XRP Is Still Facing Major Bearish Pattern XRP News: Is the SEC Dropping Ripple Case? Ex-White House Director Hints at Resolution Uniswap Faces Community Backlash Over Unichain Layer 2 Mainnet Launch Indian town adopts Avalanche blockchain for tamper-proof land records Movement (MOVE) Bounces Back: From All-Time Low to Market’s Top Performer Bitcoin Reclaims $90K Level, Ondo Skyrockets 14% Daily (Market Watch) Can XRP Reach $3.00? Santiment Poll Suggests So Dubai state-owned bank Emirates NBD debuts crypto trading on Liv X app Ethereum regains $2300 despite weakening DeFi metrics: Will Crypto Summit lead to more gains? Scam Alert: Fake National Hong Kong Coin Launch on Solana Exposed Expert Shares 3 Reasons to Go All-in on XRP Now Tether Freezes Garantex Accounts Worth Approximately $28 Million: What’s Happening? Bitcoin ETFs record third straight day of net outflows led by Valkyrie’s BRRR The News That FTX Creditors Have Been Eagerly Waiting For Has Arrived! The Next Repayment Date Has Been Announced! Here Are the Details Humanitarian Aid Without Delays? Stellar’s Blockchain Solution Explained Crypto Price Analysis March-06: ETH, XRP, ADA, BNB, and SOL Analysts Predict Major Bitcoin Rally in Late March as M2 Money Supply Grows Stablecoin Market Surges to $229.98 Billion Reflecting Growing Demand Bitcoin Adds 50K Addresses, but a Breakout May Not Be On the Horizon Yet Strategy’s Saylor Explains Why US Needs Bitcoin Bitcoin reclaims $92K, but sentiment still stuck in ‘Extreme Fear’ Trump may be the "raging bull" of crypto, yet the EU may have the upper hand Fireblocks Unveils Cyber Security Tools to Help Crypto Handlers Meet Europe’s DORA Rules Bitcoin gets March 25 'blast-off date' as US dollar hits 4-month low Bitcoin Could Move $5K After White House Crypto Summit; ETH and SOL Volatility Likely: STS Digital Ethereum Price Forecast: ETH holds $2,200 support despite Pectra's issues on Sepolia testnet Top crypto forecasts: Aptos, Cronos, Bitcoin Cash Bitcoin Price Attempts a Comeback—Is a Recovery Rally on the Horizon? Trader Warns XRP Now Flashing Bearish Signal That Preceded Solana and Bitcoin Correction – Here’s His Outlook Can Ethereum Price Hit $3,000 Before the Crypto Summit? XRP Kangaroo Phase Targets $27 to $222, as XRP Gears Up for Next Big Leap Cronos Price Prediction: CRO rallies as roadmap includes plans for ETF and Strategic Reserve Tariff fears wipe out SOL’s weekend gains SafeMoon (SFM) Holds Gains After Solana Migration, But Could Drop 55% Senate vote against DeFi broker rule a ‘hopeful sign’ Chainlink Price Jumps Past $15 As Whale Accumulation Signals Strength Gala Games to Offer Seamless $GALA Buyouts by Integrating Alchemy Pay BTC Price Analysis: Bulls Eye $95K as Key Resistance Levels Tighten Binance’s wBETH Quietly Became the No. 2 Liquid Staking Contender The Clay Artisan of Bitcoin: How Trump’s Words Mold Crypto Trends Crypto Market Today (Mar 6): BTC Nears $92K, Major Altcoins Gain Cryptocurrency vs. Government Currency: What’s the Difference? Russia Could Develop a Crypto Reserve—Expert Discusses Timeline Institutional Investors Brace for Crypto Boom With Trump's Regulatory Overhaul E-commerce market cap poised for growth; GTA 6 eyes metaverse New Hampshire Bitcoin bill passes through House committee in a landslide Crypto News: Cardano’s Hoskinson Snubbed for White House Crypto Summit, Ripple CEO on the List Robinhood Draws Nearly 400K Players in First $1 Million Bitcoin Trivia Game Binance Dominates CEX Reserve Flows with $4.5B Monthly Increase May election could open floodgates to institutional crypto: OKX Australia CEO Pi Coin Price Prediction: Bulls Break $2, Next Target $3 Why Bitcoin Bull Market Fears Matter Falling US dollar is signaling a strong quarter for crypto: Raoul Pal Avalanche: A New Framework for L1 Development A Complete Guide to AI Trading Bots on Bitget Bitcoin Price Analysis: Whale Transactions Down 30% as BTC Approaches $100K Bitcoin, Ethereum Rally as Markets Weigh Trade Tensions and China's Stimulus Push Trump’s crypto reserve likely to be mostly Bitcoin, bigger than expected: Bitwise Today’s Crypto Market: BTC at $89K, Trump Trade War Effect, NEIRO, FINVESTA Lead Top Gainers Bitcoin Tests $90,000 Levels Amid Speculation Around Trump’s Crypto Summit Whales Buy Cardano After US Crypto Policy Announcement Ripple (XRP) Price Could Reach $10 if this Binance Trading Signal Persists Top 12 Blockchains by NFT Sales Volume in February – Who Dominated? Stablecoin Payment App Wirex Enters the US Market With Bridge.XYZ Mt. Gox moves over $1 billion in Bitcoin as price hits $90,000 Ethereum (ETH) Recovers 6%, But Bears Still Hold Control Analyst Predicts Dogecoin Price Rally To $6.24 If This Condition Holds US Authorities Are Releasing Seized Bitcoin Mining Hardware: Reuters StakeStone and HashKey Partner to Enhance Omnichain Liquidity for DeFi Expansion Shiba Inu (SHIB) Delivers Grim Volume Signal, Bitcoin (BTC): Is it Trying to Break $90,000? Solana (SOL): Days Before Recovery? Analysts Predict Solana Price Next Big Move As Key Support Holds Trump advisers start mapping out a plan for a national crypto reserve The AI Agent Bubble Has Popped As Speculative Trading Fades BioNexus picks Ethereum over Bitcoin for treasury due to its programmability and utility Hedera (HBAR) Gains 30% in a Week as Indicators Point to More Upside Trump Jr-backed predictions market, Kalshi receives Nevada gaming board notice SEC and CFTC Make Unexpected Statement on Cryptocurrency Enforcement: “We’re Not Walking Away” – What Does It Mean? Dogecoin Price Eyes Rally As Wallet Addresses Reach All Time High Argentine Prosecutor Moves to Freeze $100M in Crypto Raised by LIBRA Sale BREAKING NEWS: Tonight is Spot ETF Night! Another Unexpected Altcoin ETF Application Made! Ministry of Finance in Russia Launches “Experimental Cryptocurrency Initiative” Canary Capital Files to Launch ETF Tracking Cross-Chain Protocol Axelar Livepeer Price Prediction 2025-2031: Will LPT Price Spike Higher? Hela Space Join Hands with Pixiland to Bring Forth a New Era of Gaming DoubleZero's 'New Internet' for Blockchains Nabs $400M Valuation from Top Crypto VCs Chinese Analyst Says, “I Expect Big Change,” Shares Bitcoin Price Prediction and Predictions AXL's price jumps 14% as Canary Capital files for Axelar ETF Robinhood CEO touts blockchain as antidote to stock market inefficiencies South Korea inches closer to Bitcoin ETF decision, looks to Japan as example ETHDenver 2025 includes policy at developer-centric event Aave community pushes GHO stablecoin growth with governance votes, including proposal for yield-bearing 'savings' token Analytics Company Shares 7 “Most Negative” Altcoins According to Funding Rates Skate launches AMM with cross-VM support including Solana, Ethereum Bitcoin must conquer $92k to build upwards momentum, $70k key zone for support US crypto reserve clarification coming? Wait til Friday. VeChain Price Prediction: Can VET Hit $0.040 Soon? Robinhood Will Hand Out $2 Million in Bitcoin, Dogecoin in Trivia Game From 'HQ' Host Cardano Price Prediction: ADA Eyes Breakout Above $1.50 Resistance for a Major Rally Bitcoin network used to secure local GOP convention election results Penomo & Hoovest Financial Group Partner for Tokenized AI & Infrastructure Finance What’s the strike price on Trump’s put? Ethereum price ‘double top’ hints at 42% drop as ETH bull market ends Bitcoin Crosses $90K as Trump Delays Canada, Mexico Auto Tariffs What Is ‘Bitcoin Miner’? This Free iOS and Android Game Pays Real BTC Ethereum’s Next Move: Rally Toward $4K or Bearish Reversal? Arbitrum (ARB) Surges 12% After Robinhood Listing: What’s Next? US authorities begin releasing some seized cryptocurrency miners, industry executives say Analysis Company Shares Deep Technical Analysis: Where is the Resistance and Bottom in Bitcoin? What Are Options Traders Doing? Early $PEPE Whale Splashes $3.95M on $AAVE: Is a Bigger Move Coming? Is Trump’s crypto strategic reserve just a front to pump WLFI and his own bags? Degen Ethereum NFT collection Mfers gets an animated short The Real Lifestyle and Plena Collaborate to Reinvent Blockchain and Real Estate Buy Dogecoin Now? Analyst Says This Is the Spot What’s the Latest on XRP Spot ETF Approval? Analysts Assess the Chances of Approval Vietnam to pilot digital currency exchange: report Solana's Growth Falls 88% Veteran Trader Believes Bitcoin Low Is In, Says Downside Volatility Presenting Bullish Opportunities Bitcoin volatility soars amid US crypto reserve, tariff jitters Singapore’s Interior Minister Warns Citizens to Avoid Cryptocurrencies Bitcoin developer Peter Todd criticizes inclusion of altcoins in Strategic Crypto Reserve Ripple CEO Opposes “Zero Sum” Mindset in Crypto JUST IN: The Highly Anticipated FED’s Beige Book is Released – Here’s What to Know BREAKING: Coinbase Announces a Surprise Altcoin Listing Bitcoin Blockchain Used To Secure Results Of Tennessee County’s Republican Convention Vote Circle announces bridged-to-native USDC upgrade for Linea Ethereum In 2024 Vs. 2025: What Important Technical Indicators Are Saying Coinbase plans to tokenize $COIN stock in renewed security token push Mastercard and 9dcc Launch NFT-Linked Apparel for Arnold Palmer Golf Tournament CleanSpark bolsters Bitcoin treasury by 6% in February Bybit hackers moves stolen funds through crypto mixers and Wasabi Wallet